


Integration of Basic Tools for Visualization and Analysis All of our stakeholders point out the important role that "basic" visualization and analysis capabilities play in the day-to-day process of scientific inquiry and discovery. These include charting, graphing, plotting, and filtering. We also include: visualization "staples" for visualizing scalar fields (isocontouring, hyperslicing, direct volume rendering), vector fields (direct representation techniques like glyph-based visualization and indirect representation techniques like streamlines and particle advection), support tools like transfer function editors, dimension reduction and projection techniques like orthogonal and arbitrary slicing, and techniques for displaying computational grids. It has been stressed that any new visualization and analytics techniques that emerge from our project, or any other visualization project, must seamlessly integrate with their existing visualization tools. Therefore through careful attention to software design and engineering, we aim to provide "staple" and new technologies that are well integrated. This approach minimizes the disruption for our stakeholders, increases the likelihood of day-to-day use in science research and protects DOE's investment in visualization research and development. Both of the primary delivery vehicles for our work - VisIt and SCIRun - provide such staple visualization capabilities. Both are architected to accommodate new tools and capabilities; these are presented to the stakeholder in the same application environment without the need to launch a separate application. The primary work activities for our project in this area will be to:
|
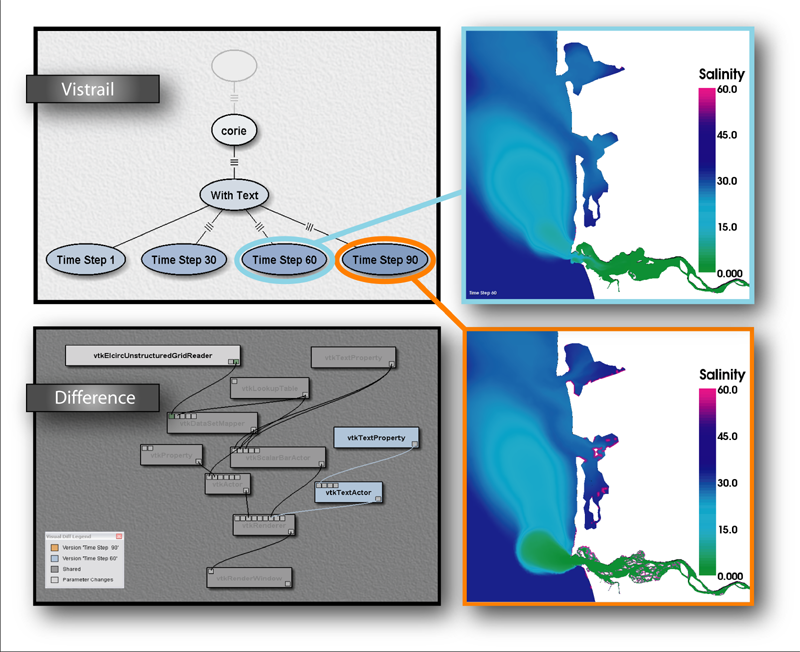 VisTrails 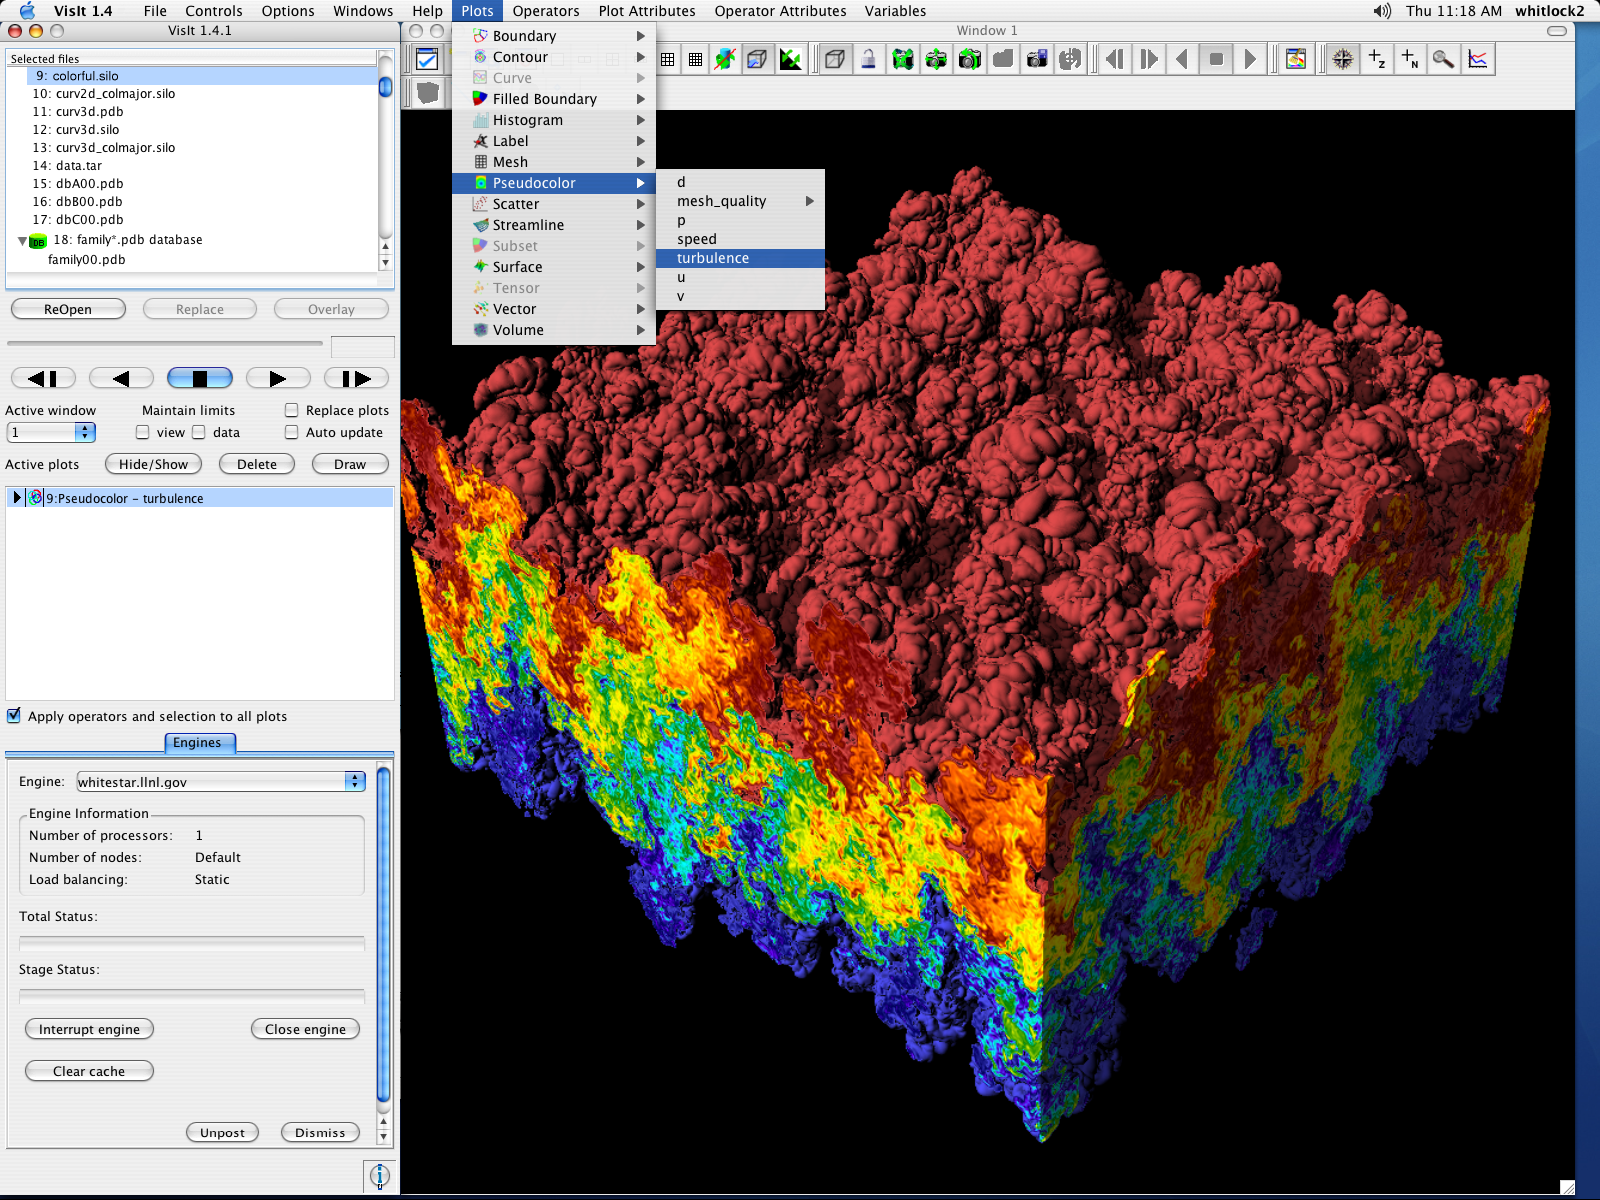 VisIt 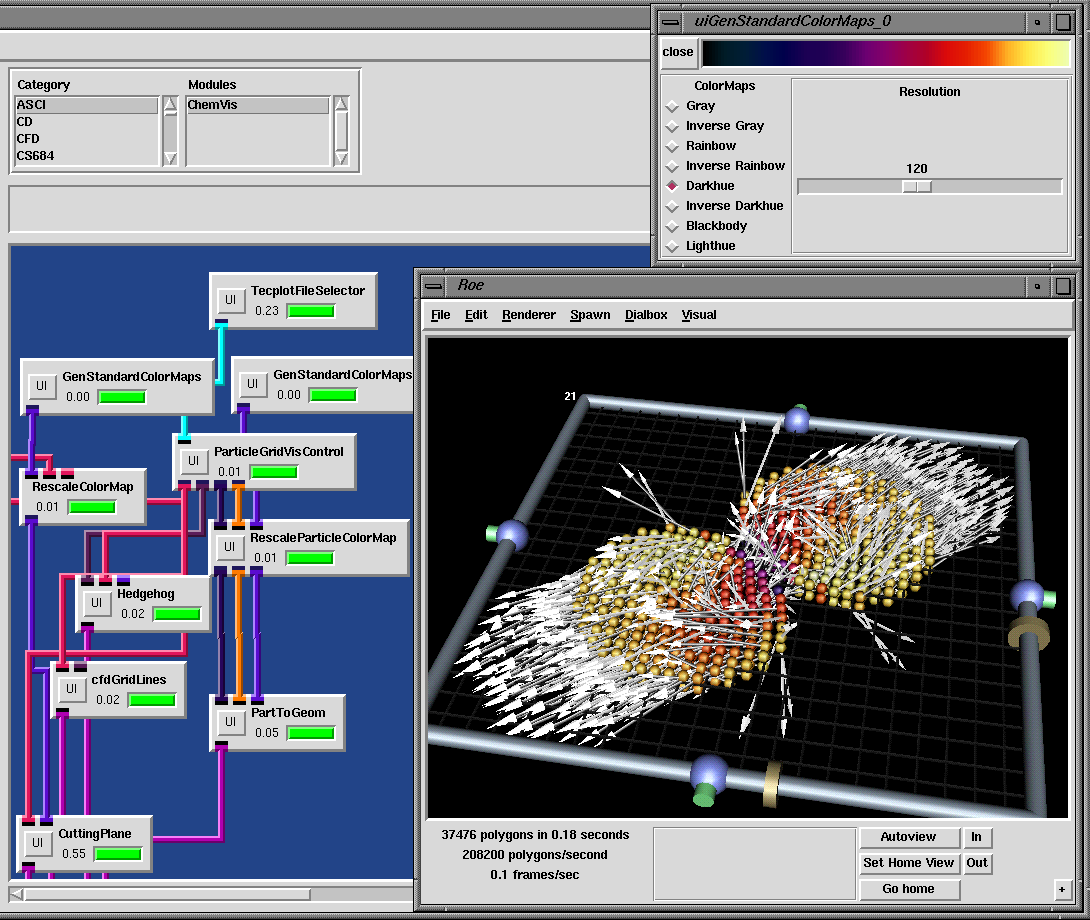 SCIRun |