


Query Driven Visualization Query-driven visualization refers to the process of limiting visualization and analytics processing to data a user deems "interesting." It forms the basis for many of our Center's work targets, including: feature detection, feature mining, and correlated linked views. We will begin implementation first by integrating the results of an ongoing complementary effort that is developing a "veneer API" to simplify access to the index/query engine. It achieves increased portability between applications and provides for a common, portable, and parallel-capable index/query implementation. Second, we will coordinate with the SDM center and our individual stakeholders to implement this capability for use in our Center's technology thus facilitating technology transfer from the SDM center into our stakeholder deliverables. Third, with individual stakeholders, we will refine the ability to easily pose queries that define "interesting." Such semantic range queries are compound Boolean expressions of the form "(temperature < 1000) AND (density > 0.95)". Fourth is effective management and display of query results. The query returns what is best though of as an unstructured collection of grid cells or points requiring effective multi-field visualization for display and software engineering to minimize the memory footprint. Fifth, we will integrate evolving query technology from the SDM center. Our previous implementations of query-driven visualization process grid points, which are returned by the query engine. We anticipate evolution of the index/query technology to include several new features that will support our needs, including: topological- and spatial-based queries that return "nearby" points, cell-based queries that return hexahedral grid cells rather than grid points, and so forth. |
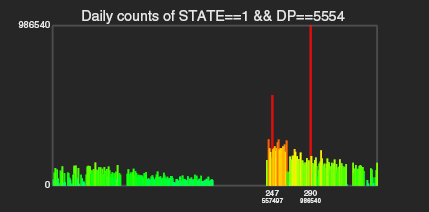 Histogram showing number of unsuccessful connection attempts over one year with daily temporal resolution. Red bars indicate three standard deviations or greater variance from mean values, which are shown as green bars. 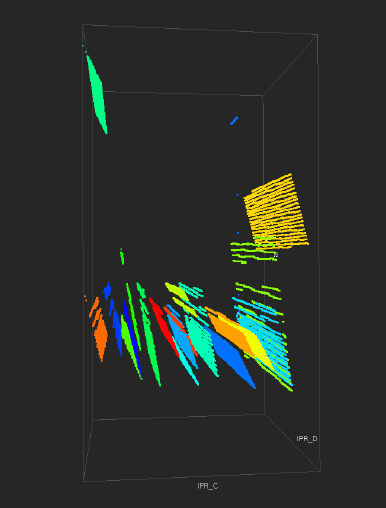 3D histogram shows the destination address space being attacked by each of the twenty hosts participating in the distributed network scan. |