


Climate The general goal of the climate research effort within SciDAC is to understand large scale climate change dynamics over very long time periods. To ensure confidence and accuracy in their simulations, climate scientists must couple many different simulation methods into a single "meta-simulation" that combine ocean, atmospheric, land use, vegetation, biochemistry, ecosystem dynamics, and other models. As a consequence, climate simulations often contain as many as 200 variables per grid point. Accurate simulations require a fairly short timestep - between 15 minutes and 6 hours. Performing hundreds of years of simulated time results in hundreds of terabytes of data. Since the emphasis is on large scale climate change rather than regional weather simulation, the spatial grids are generally not very large. The data-intense areas are generally multivariate and temporal. However, computational climate efforts are increasing in spatial resolution to support regional models suitable for weather forecasting. So-called "ensemble runs" of a given climate model produce hundreds of different simulation data sets leading to a substantial challenges in data management and comparative analysis. Such simulations are expected to provide broad insight into the impacts of human activity over long time periods, provide policy-relevant information about energy policies, and help to predict the trends of natural disasters. From our Center, these stakeholders have requested:
See Gallery: Climate |
 Volume visualization from a weather simulation. 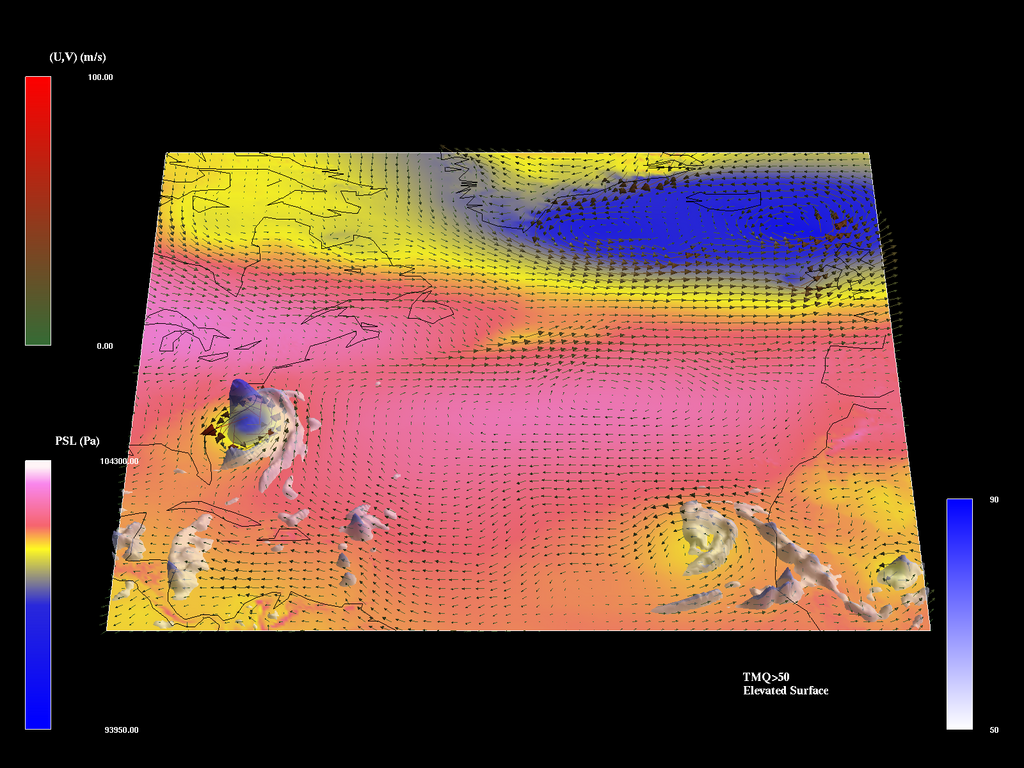 Time evolution visualization of a September 1970 hurricane data set. |