


Images & Movies
High-Dimensional Data Visualization
|
Uncertainty Visualization Uncertainty information is an important characteristic associated with much of the data scientists encounter. Such information is typically included with the data as 2D charts and graphs; however incorporating uncertainty into visualization techniques has proved quite challenging. This video presents novel visualization approaches for a class of uncertainty data that is generated from the sensitivity analysis of electrocardial potentials. The data can be characterized as a set of probability density functions (PDFs) defined across a triangular mesh, however we are also interested in the relationship between input and output parameters of the sensitivity analysis. This increases the complexity of the data set, and motivates a visualization approach that provides for exploration of the data set. | ||||
"Towards the Visualization of Multi-Dimentional Stochastic Distribution Data" Kristin Potter, Jens Krueger, Chris Johnson |
||||
|
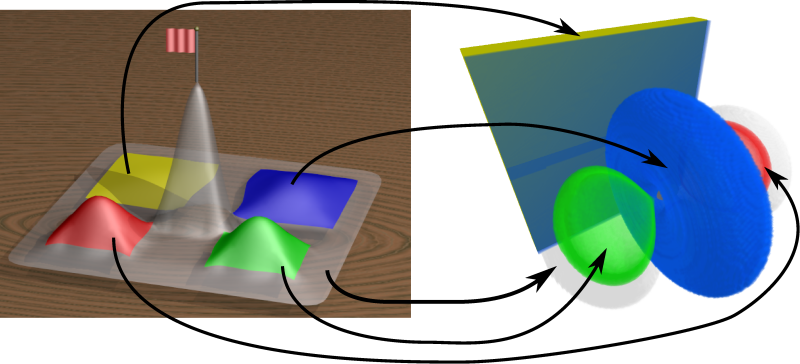
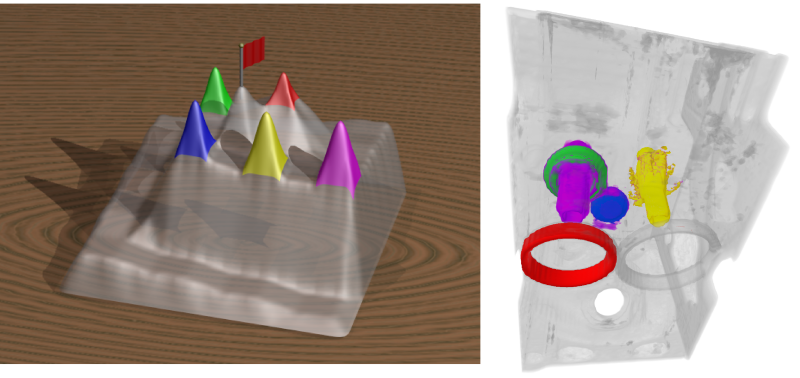
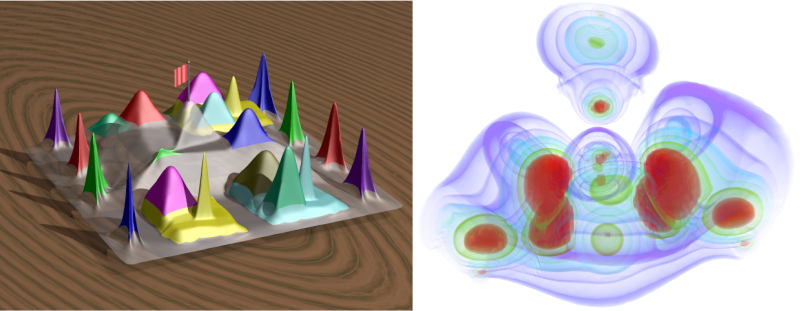
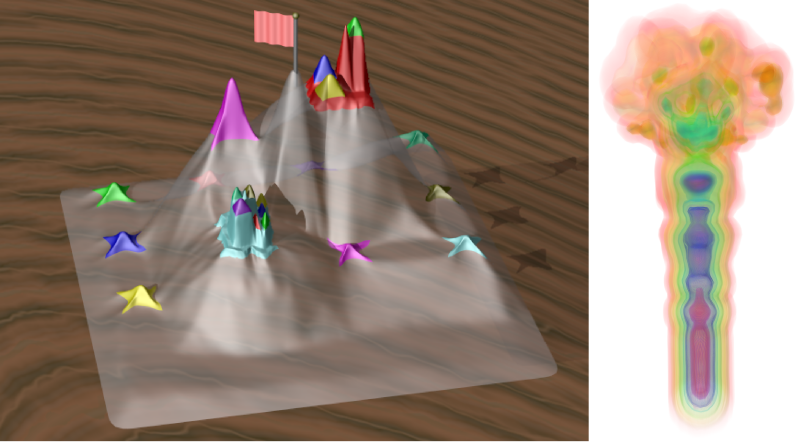
Topological Landscapes: A Terrain Metaphor for Scientific Data Topological landscapes map a contour tree that describes the topology of high-dimensional data sets to 2D landscapes. Peaks and valleys in the terrain represent minima and maxima of the original data set. Reparameterization of the landscape supports mapping measures, such as the volume of a topological feature, to the area of the "proxy" peak or valley, while persistence (i.e., the "value range" of a topological feature) is shown as height of representing peaks or valleys. By displaying this topologically equivalent landscape together with the original data we harness the natural human proficiency in understanding terrain topography and make complex topological information easily accessible. The images show topological landscapes for various test data sets commonly used in the visualization community. Left panels show landscapes, while the right panels show corresponding volume rendered images. For the engine, hydrogen atom, methane and nucleon data set, features are shown in the same color in both panels. |
||||
Hydrogen: Notice how the landscape helps appreciate the fact that the two lobes in the hydrogen orbital (red, green) have larger function range than the toroidal ring in the middle (blue), although the ring takes a larger volume. One can also clearly see a large region at nearly zero persistence (yellow), which is probably an artifact from the construction process. In the past we completely missed this region due to its low function value even though it occupies a large portion of the volume. Authors: Gunther H. Weber, Peer-Timo Bremer, Valerio Pascucci. |
Methane: In this case it is interesting to see how the landscape immediately clarifies, which feature is built around a minimum/ maximum, something not evident from the volume rendering. In particular, the main feature related to the carbon atom is associated with a large minimum, while each hydrogen atom is associated with two maxima. Clearly, the combination of these two images, even without interactive exploration, provides a better explanation than either of them independently. Authors: Gunther H. Weber, Peer-Timo Bremer, Valerio Pascucci. |
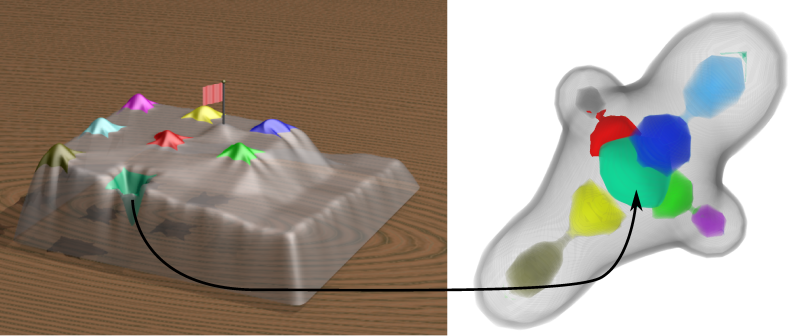
Nucleon: For the nucleon and engine datasets, considerations similar to those for the hydrogen atom and methane data sets apply. The topological landscape immediately relates which regions are associated with maxima and minima and their persistence. Moreover, one understands better, which features take a large portion of the volume even though the 3D rendering does not contain that information explicitly due to occlusion. Authors: Gunther H. Weber, Peer-Timo Bremer, Valerio Pascucci. |
Engine: For the nucleon and engine datasets, considerations similar to those for the hydrogen atom and methane data sets apply. The topological landscape immediately relates which regions are associated with maxima and minima and their persistence. Moreover, one understands better, which features take a large portion of the volume even though the 3D rendering does not contain that information explicitly due to occlusion. Authors: Gunther H. Weber, Peer-Timo Bremer, Valerio Pascucci. |
|
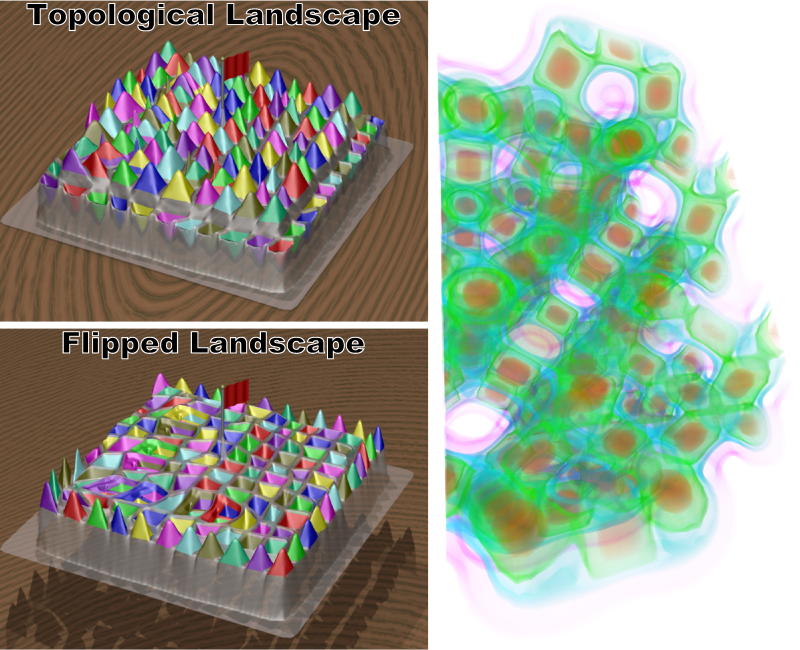
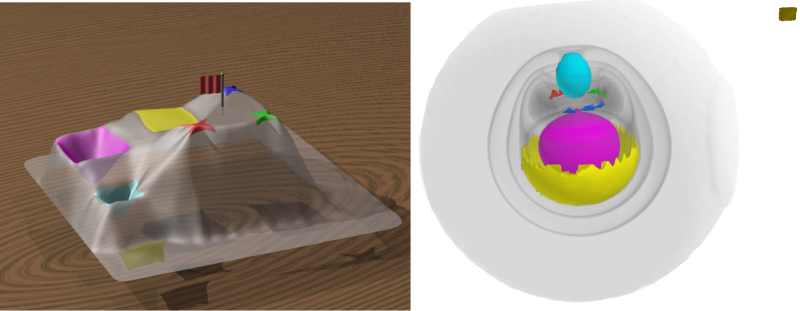
Silicium: The silicium, neghip, and fuel dataset visualizations show topological landscapes together with a more traditional volume rendering using a global transfer function. This leads to a reduced correlation between the two visualizations and therefore hampers the benefit of the simultaneous presentation. Nevertheless, one can derive information that would not be obvious otherwise. In the case of the silicium data set, for example, one notices that the structures forming the lattice of the crystal are a set of maxima and minima all of similar persistence and all occupying similar volumes. This is easy to see in the topological landscape and its flipped counterpart. The volume rendering complements this information with a sense of the geometric shape of the actual crystal. For the neghip dataset the topological landscape reveals that many features that are small in terms of volume but span a large function range. Their geometric distribution is highlighted by the volume rendering. Authors: Gunther H. Weber, Peer-Timo Bremer, Valerio Pascucci. |
Neghip: The silicium, neghip, and fuel dataset visualizations show topological landscapes together with a more traditional volume rendering using a global transfer function. This leads to a reduced correlation between the two visualizations and therefore hampers the benefit of the simultaneous presentation. Nevertheless, one can derive information that would not be obvious otherwise. In the case of the silicium data set, for example, one notices that the structures forming the lattice of the crystal are a set of maxima and minima all of similar persistence and all occupying similar volumes. This is easy to see in the topological landscape and its flipped counterpart. The volume rendering complements this information with a sense of the geometric shape of the actual crystal. For the neghip dataset the topological landscape reveals that many features that are small in terms of volume but span a large function range. Their geometric distribution is highlighted by the volume rendering. Authors: Gunther H. Weber, Peer-Timo Bremer, Valerio Pascucci. |
Fuel: The silicium, neghip, and fuel dataset visualizations show topological landscapes together with a more traditional volume rendering using a global transfer function. This leads to a reduced correlation between the two visualizations and therefore hampers the benefit of the simultaneous presentation. Nevertheless, one can derive information that would not be obvious otherwise. In the case of the silicium data set, for example, one notices that the structures forming the lattice of the crystal are a set of maxima and minima all of similar persistence and all occupying similar volumes. This is easy to see in the topological landscape and its flipped counterpart. The volume rendering complements this information with a sense of the geometric shape of the actual crystal. For the neghip dataset the topological landscape reveals that many features that are small in terms of volume but span a large function range. Their geometric distribution is highlighted by the volume rendering. Authors: Gunther H. Weber, Peer-Timo Bremer, Valerio Pascucci. |
||