


Images & Movies
Accelerator
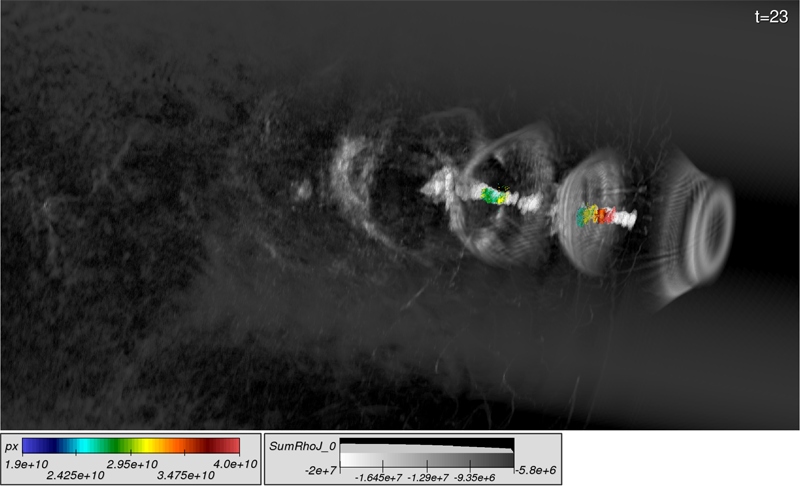
This image shows two particle bunches (color) detected automatically by the beam path analysis in a large 3D data set. A volume rendering of the plasma density (gray) shows the structure of the plasma wave, illustrating the location of the two bunches within the wave. |
|||
 A radial slice of a CASTRO calculation shown on the "globe display" at the LBNL booth at SC09. |
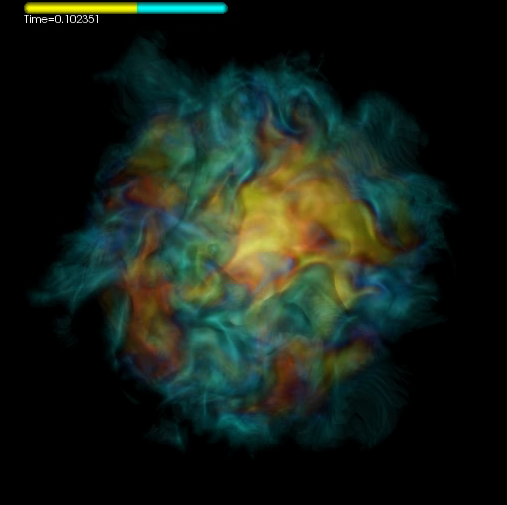 Image, created by VACET, from a movie of CASTRO simulation output for Adam Burrow's team showing the variable entropy. |
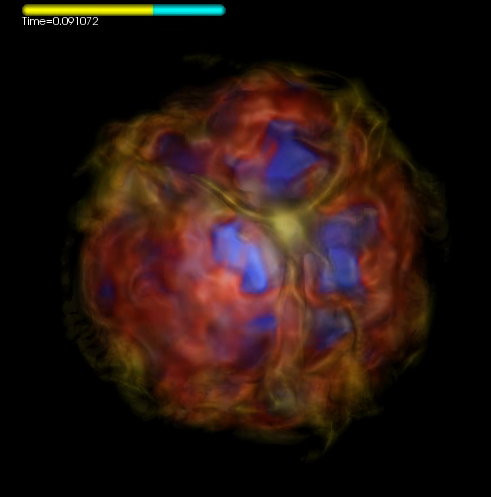
Image, created by VACET, from a movie of CASTRO simulation output for Adam Burrow's team showing the variable Ye. |
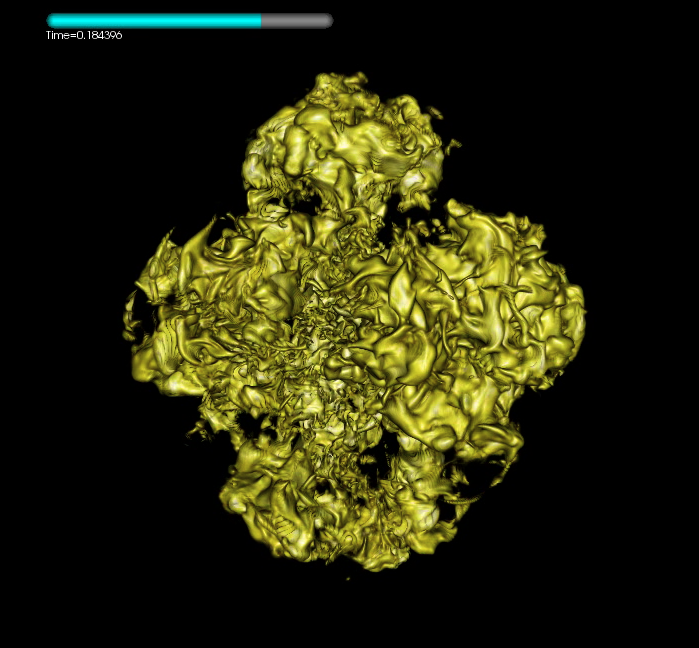
Image, created by VACET, from a movie of CASTRO simulation output for Adam Burrow's team showing radial velocity. |
|
|||
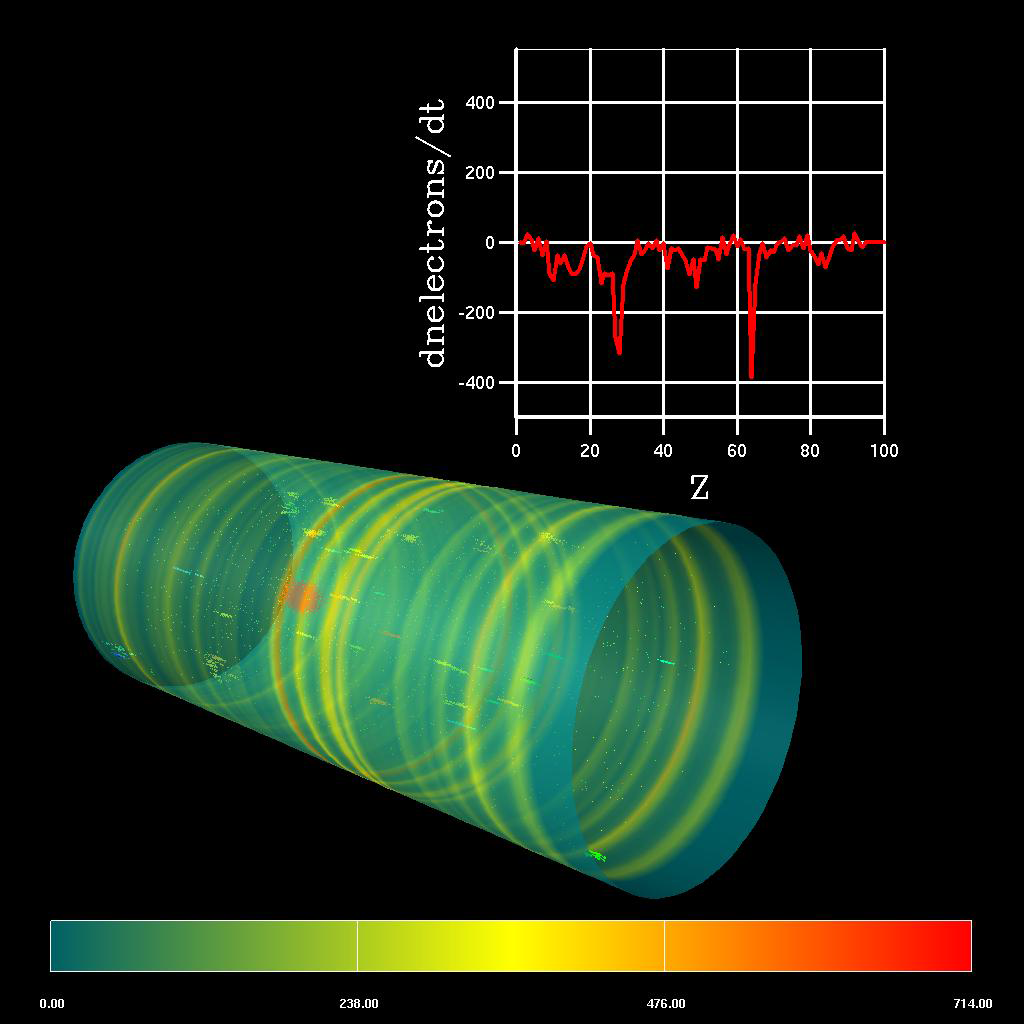 This image shows a proton beam moving along the beam pipe (z-axis) in the presence of an electron cloud. The proton beam is shown in red in the center of the pipe. A. Adelmann, PSI. |
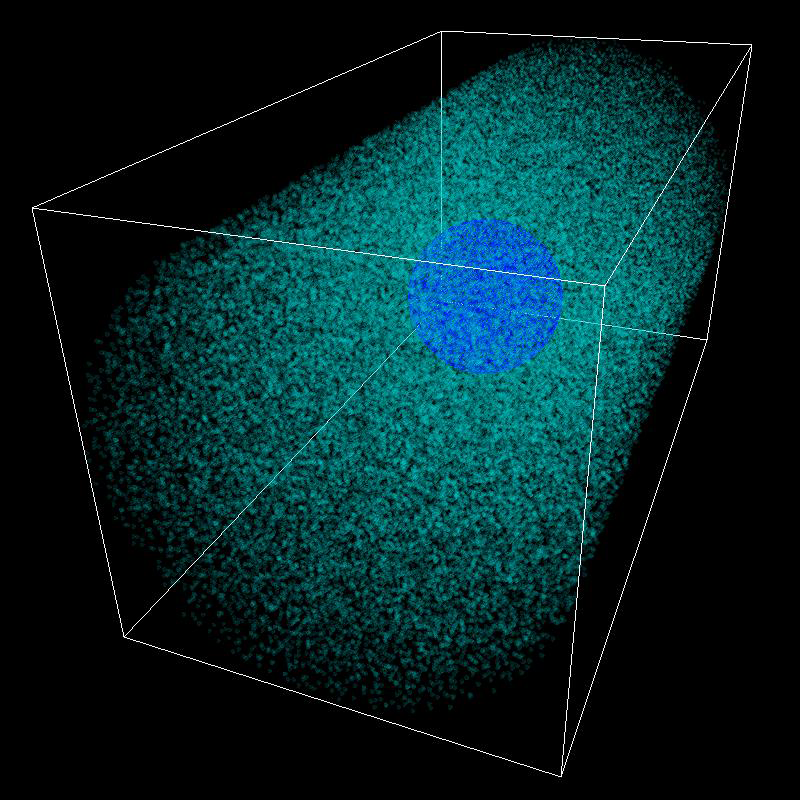 Electron Cloud simulation with electrons and protons rendered as particles. A. Adelmann, PSI. |
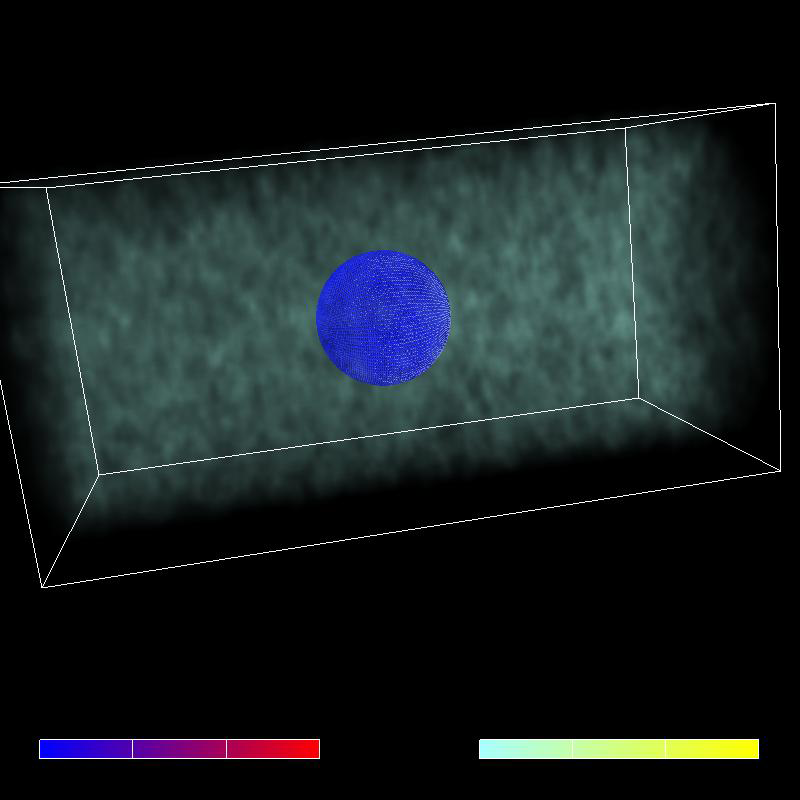
Electron Cloud simulation with electrons rendered as volume density and protons rendered as particles. A. Adelmann, PSI. |
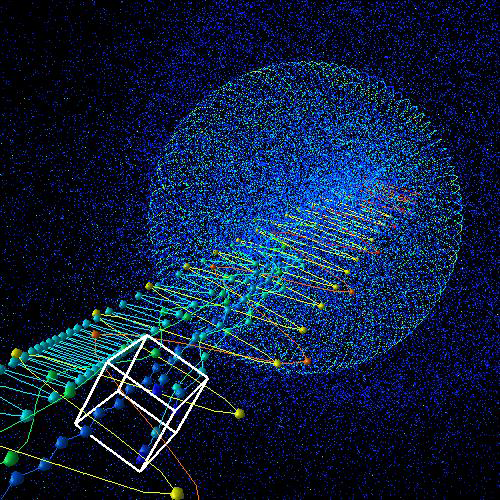
Electron Cloud simulation: trajectories of electrons as the simulation progresses rendered as splines colored by the magnitude of the velocity. A. Adelmann, PSI. |
Electron Cloud simulation: trajectories of electrons as the simulation progresses rendered as splines colored by the magnitude of the velocity. A. Adelmann, PSI. |
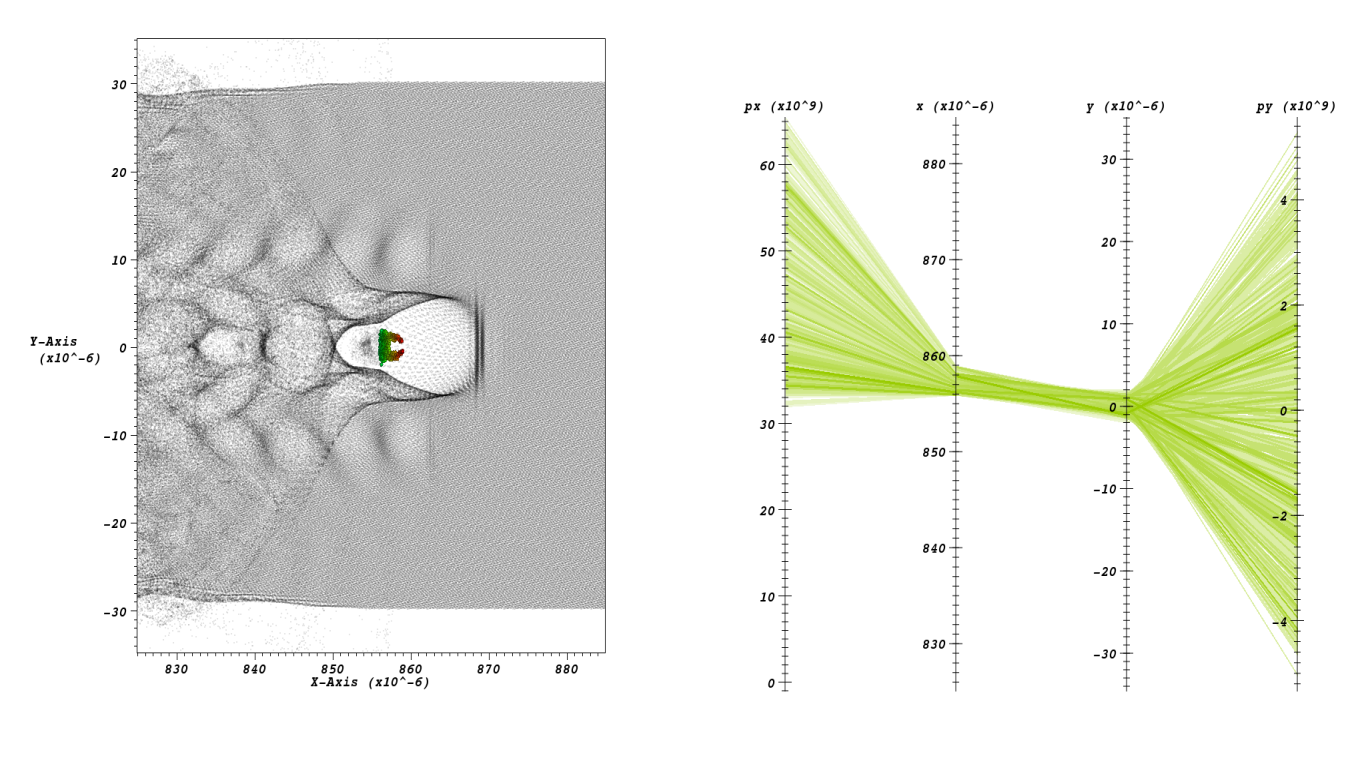
Tracking particles along a beam line. A. Adelmann, PSI. |
Tracking particles along a beam line. A. Adelmann, PSI. |
Tracking particles along a beam line. A. Adelmann, PSI. |
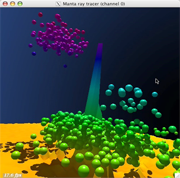
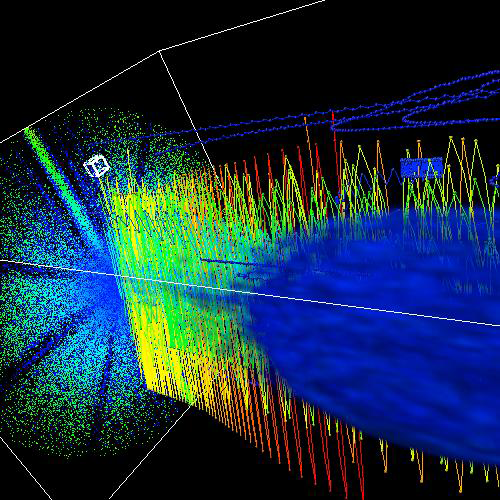
The heightfield represents particle density from a VORPAL dataset of a laser wakefield acceleration. The spheres are individual particles whose velocity exceeds a certain threshold. Since we only had access to a single timestep of data, we randomly perturbed the heightfield and spheres to show we can handle time-varying datasets. T. Ize, SCI. Data data provided by Tech-X corporation and Peter Messmer. |
|||
For more information please see the LBNL/NERSC Visualization Group website.